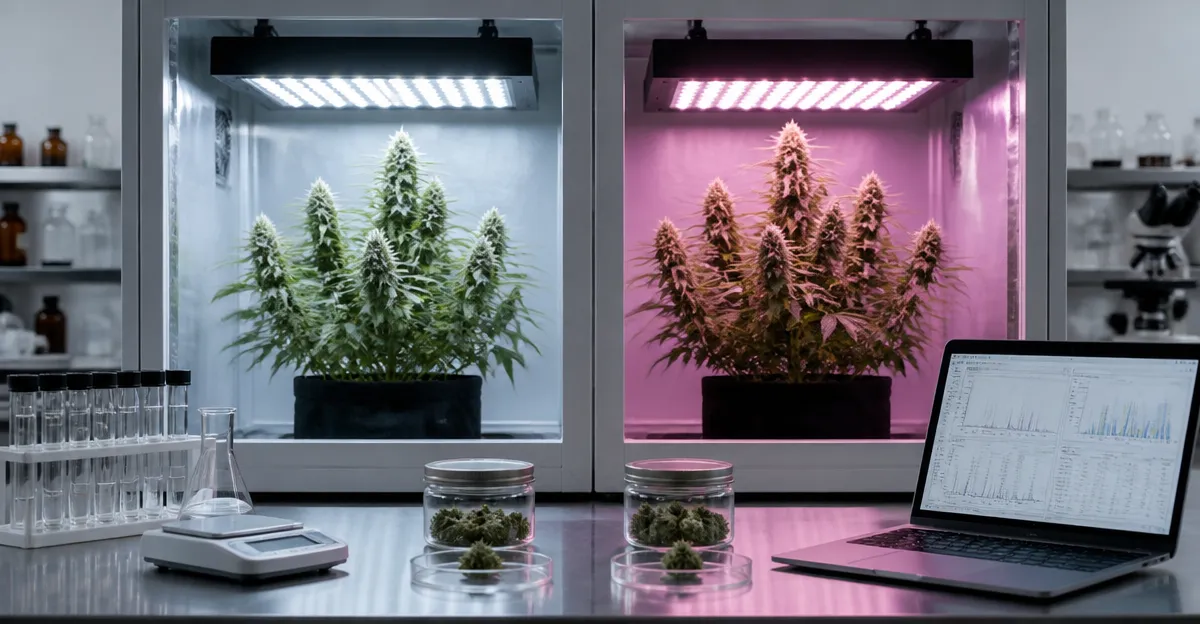
How to Conduct a Grow-Light A/B Test to Maximize Terpene Preservation: Step‑by‑Step Protocol
Introduction
In this guide, one will discover how to design and execute an A/B test that isolates the impact of different grow‑light spectra on terpene retention. Terpenes are volatile aromatic compounds that contribute to flavor, aroma, and therapeutic value; preserving them during cultivation can increase market value and consumer satisfaction. The protocol presented combines scientific rigor with practical tools, allowing growers of all scales to make data‑driven decisions without excessive cost.
Readers will learn how to select comparable plant cohorts, control environmental variables, record quantitative terpene data, and interpret statistical outcomes. By the end of the article, one will be equipped to run repeatable experiments, adjust lighting strategies, and confidently report results to stakeholders.
What You'll Need
- Two or more grow‑light units with distinct spectral profiles.
- Timer or programmable controller for consistent photoperiods.
- Light‑meter (PAR) to verify equal photon flux density.
- Thermal probe to monitor temperature at canopy level.
- Gas chromatography or terpene‑specific assay kit for post‑harvest analysis.
- Standardized growing containers, soil or hydroponic media, and identical nutrient regimen.
Below are five Amazon products that fulfill many of these requirements. Each recommendation includes a brief justification for its inclusion in the test.
Step‑by‑Step Instructions
Step 1: Define the Experimental Question and Hypothesis
Begin by stating a clear, measurable hypothesis. For example, "A 6000K full‑spectrum light will retain 15% more limonene than a 5000K light when all other variables are equal." Write the hypothesis in a lab notebook, noting the specific terpene(s) to be quantified. This step establishes the framework for data collection and statistical analysis.
Step 2: Select Light Sources with Complementary Spectra
Choose two lights that differ primarily in spectral output while offering comparable power consumption. The GooingTop Grow Light provides a 6000K white spectrum supplemented by red LEDs, delivering a balanced blue‑red mix ideal for vegetative growth. Its 10 Red + 74 White LEDs, 95 CRI, and USB/AC power options make it easy to position and power in a controlled environment. Priced at $20.99 with a 4.5‑star rating from 22,083 reviews, it offers reliable performance at low cost.
For the comparison unit, the Barrina T5 Grow Lights deliver a 5000K full‑spectrum output using 96 LEDs per fixture. Each 1‑ft tube consumes 20 W, replaces a 120 W traditional lamp, and can be linked in series for uniform coverage. At $28.79 for a four‑pack and a 4.6‑star rating from 7,003 reviews, the system provides scalable intensity and independent on/off switches for precise control.
Both lights feature adjustable mounting options, allowing the researcher to maintain a constant distance (typically 6–12 inches) from the canopy. Using lights with similar wattage ensures that photon flux density (PPFD) can be matched, isolating spectrum as the sole variable.
Step 3: Calibrate Light Intensity and Photoperiod
Employ a PAR meter to measure PPFD at plant height for each fixture. Adjust the height or use neutral‑density filters until both zones receive identical photon flux, for example 400 µmol m⁻² s⁻¹. Consistency in intensity eliminates confounding effects on terpene synthesis.
Program the built‑in timers to deliver the same photoperiod. The GooingTop Grow Light includes three preset timers (4 h, 8 h, 12 h). Set both lights to an 8‑hour cycle, which is common for vegetative stages. The Barrina T5 units lack built‑in timers, so connect them to an external plug‑in timer or a smart outlet; this approach offers finer granularity and can be synchronized with the GooingTop unit.
Document the exact settings in a spreadsheet: light model, distance, PPFD, timer schedule, and power source. This record will be essential for reproducibility.
Step 4: Prepare Identical Plant Cohorts
Select genetically uniform clones or seeds and grow them in identical containers with the same substrate. Label each plant with a unique identifier that includes the treatment group (e.g., "A" for GooingTop, "B" for Barrina). Maintain identical watering, nutrient, and temperature regimes across both zones.
Place a temperature probe at canopy level to verify that both zones remain within ±2 °C of each other. Light‑generated heat can differ between fixtures; the GooingTop lamp consumes only 10 W and runs cool, while the Barrina T5 tubes, though efficient, may produce slightly more warmth. Adjust ventilation if needed to keep temperature constant.
Allow the plants to acclimate for one week under the assigned lighting before beginning data collection. This period stabilizes physiological responses and reduces shock effects.
Step 5: Conduct Periodic Terpene Sampling
At predetermined growth stages (e.g., pre‑flower, mid‑flower, harvest), collect leaf or bud samples for terpene analysis. Use a consistent sampling method: harvest 2 g of tissue, freeze in liquid nitrogen, and store at –80 °C until extraction.
If a laboratory is unavailable, the Briignite LED Grow Light Bulb can serve as a supplemental light source for a controlled extraction chamber, providing a full‑spectrum 4000K illumination that mimics natural sunlight without introducing additional spectral bias. Priced at $8.98 with a 4.6‑star rating from 13,616 reviews, the bulb fits standard E26 sockets and consumes only 11 W, making it energy‑efficient for prolonged use.
Analyze terpene concentrations using gas chromatography‑mass spectrometry (GC‑MS) or a reputable terpene assay kit. Record the absolute values (µg g⁻¹ dry weight) for each sample, noting the treatment group.
Step 6: Perform Statistical Analysis
Import the dataset into statistical software (e.g., R, Python, or Excel). Conduct a two‑sample t‑test to compare mean terpene levels between the two lighting groups. Verify assumptions of normality and equal variance; if violated, apply a non‑parametric Mann‑Whitney U test.
Calculate effect size (Cohen's d) to quantify the practical significance of any observed differences. A p‑value <0.05 combined with a large effect size (>0.8) indicates a meaningful impact of spectral composition on terpene preservation.
Document the analysis workflow, including code snippets or formulae, to ensure transparency and reproducibility.
Step 7: Iterate and Refine
If the initial test shows marginal differences, consider adding a third lighting condition, such as the Aokrean Grow Light, which offers three lighting modes (white, warm white, red) and ten brightness levels. Priced at $25.99 with a 4.4‑star rating from 3,568 reviews, the Aokrean unit includes a built‑in timer (3 h, 9 h, 12 h) and telescoping pole for precise height adjustment, making it ideal for testing additional spectra.
Repeat steps 3‑6 with the new configuration, ensuring that all other variables remain constant. Over multiple cycles, a robust dataset will emerge, allowing the grower to fine‑tune the optimal light spectrum for maximum terpene retention.
Tips & Pro Tips
- Maintain Consistent Humidity: Terpene volatilization is humidity‑sensitive; keep relative humidity between 45‑55% in both zones.
- Use a Light‑Proof Divider: Prevent light bleed between treatment areas by installing blackout curtains or reflective barriers.
- Log Daily Observations: Note any visual changes such as leaf curl, discoloration, or pest activity; these may indicate unintended stressors.
- Leverage Smart Plugs: For lights without built‑in timers (e.g., Barrina T5), a Wi‑Fi smart plug can automate cycles and provide usage logs.
- Consider Heat Sink Efficiency: The LEOTER LED Grow Light features an aviation‑grade heat sink that dissipates heat effectively, reducing canopy temperature fluctuations during long photoperiods.
Troubleshooting
- Uneven Light Distribution: If PPFD varies across the canopy, add diffuser panels or adjust the distance of each fixture to achieve uniform exposure.
- Temperature Spike: Should one zone run hotter, increase airflow with an oscillating fan or relocate the heat‑generating fixture farther from the plants.
- Timer Resetting: Some units, like the LEOTER light, require timer reset after power loss. Keep a backup power supply or use an uninterruptible power source (UPS) to avoid accidental resets.
Conclusion
By following this structured A/B testing protocol, growers can isolate the effect of light spectrum on terpene preservation, make evidence‑based lighting decisions, and ultimately enhance product quality. The recommended tools—GooingTop Grow Light, Barrina T5 Grow Lights, Briignite LED Grow Light Bulb, Aokrean Grow Light, and LEOTER LED Grow Light—provide reliable performance, affordability, and flexibility for rigorous experimentation. Continued iteration and meticulous data recording will yield insights that translate into higher terpene content, better flavor profiles, and increased market competitiveness.
Products Mentioned in This Guide
Frequently Asked Questions
What is the purpose of a grow‑light A/B test for terpene preservation?
It compares different light spectra to identify which one best retains volatile terpenes, boosting flavor, aroma, and market value.
Which equipment is essential for conducting a reliable grow‑light A/B test?
You need at least two grow‑lights with distinct spectra, a programmable timer, a PAR light‑meter for equal photon flux, and a terpene analysis tool (e.g., GC‑MS or a handheld sensor).
How should plant cohorts be selected to ensure valid results?
Choose genetically identical clones or plants of the same age and health, and randomly assign them to each light treatment group.
What environmental variables must be controlled during the experiment?
Maintain identical temperature, humidity, CO₂ levels, nutrient schedules, and photoperiods across both groups, adjusting only the light spectrum.
How can growers interpret the statistical outcomes of the test?
Use t‑tests or ANOVA to compare terpene concentrations; a statistically significant higher terpene level in one group indicates the superior light spectrum.